ECE :: Automatic Control Systems
-
For stable network the real parts of poles and zeros of driving point functions must be
-
Consider the following expressions which indicate the step or impulse response of an initially relaxed system
- [5 - 4 e-2t] u(t)
- [e-2t + 5] u(t)
- d(t) + 8 e-2t u(t)
- d(t) + 4 e-2t u(t)
-
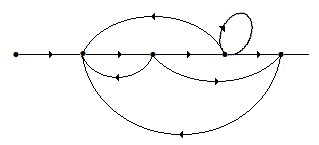
If Z is the number of zeros of 1 + G(s) H(s) in the right half s plane. N is the number of clockwise encircle elements of (-1 + jo) point. P is the number of poles of G(s) H(s) in right half s plane. The Nyquist stability criterion can be expressed as
-
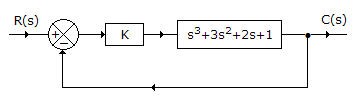
The given figure shows a control system. The maximum value of gain for which the system is stable is
-
In a synchro transmitter
-
The polar plot of G(jω) = 1/jω is
-
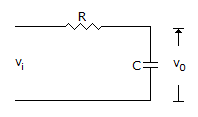
The log magnitude for the system in the given figure is (where T = RC)
-
For an unstable system the gain margin is indicative of how much the gain should be decreased to make the system stable.

 Whatsapp
 Facebook


|
A.
input is angular position of rotor shaft and output is stator voltages
|
|
B.
input is stator voltages and output is angular position of shaft input is rotor voltage and output is angular position of rotor shaft
|
|
C.
input is rotor voltage and output is angular position of rotor shaft
|
|
D.
input is angular position of rotor shaft and output is rotor voltage
|