Home / ECE / Automatic Control Systems :: Section 1

ECE :: Automatic Control Systems

  1. Bode magnitude plot is drawn between

  2. A.
    magnitude of network function and ω
    B.
    dB magnitude and log ω
    C.
    dB magnitude and ω
    D.
    loge (magnitude) and log ω

  3. For the system in the given figure,

  4. A.
    B.
    C.
    D.
    none of the above

  5. In the given figure, if R = XC, voltage gain is

  6. A.
    0 dB
    B.
    3 dB
    C.
    -3 dB
    D.
    20 dB

  7. For the circuit in the given figure, V2(s)/V1(s) =


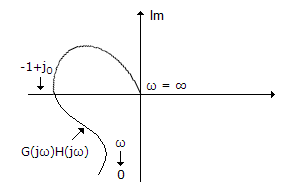
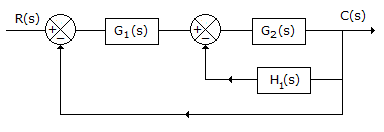
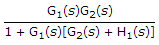
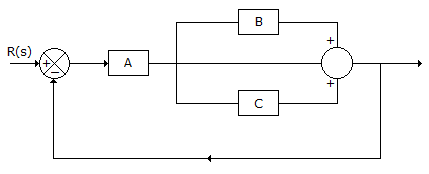
  8. The system in the given figure, has

  9. A.
    good gain and phase margin
    B.
    poor gain and phase margin
    C.
    good gain margin but poor phase margin
    D.
    poor gain margin but good phase margin

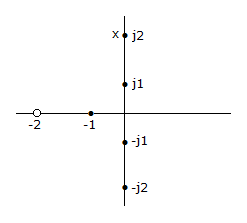
  10. The given figure shows a pole zero diagram. The transfer function G(j1) is

  11. A.
    0.5 ∠0
    B.
    2.7 ∠- 31°
    C.
    2 ∠45°
    D.
    2 ∠- 67.4°

  12. In a minimum phase system

  13. A.
    all poles lie in the left half plane
    B.
    all zeros lie in the left half plane
    C.
    all poles lie in the right half plane
    D.
    all except one pole or zero lie in the left half plane

  14. For the system of the given figure the transfer function is