Data Interpretation :: Bar charts
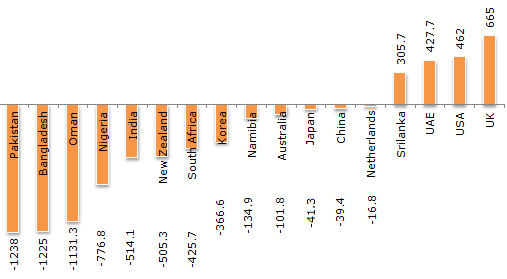
The total of the first three deficit countries (in Rs. crores) = 3594.3. The total of next five deficit countries (in Rs. crores) = 2588.5. The total of the last five deficit countries (in Rs. crores) = 334.2.
Cumulative Trade Deficit/Surplus of Countries for the Year 2006 - 2007 (All figures in Rs. Crores).
-
The ratio between the difference between the highest and the lowest of the surplus countries to the difference between Bangladesh and Oman is ?
-
The average of the total deficit of the middle five deficit is closest to the deficit of which country ?
-
The state whose surplus is nearly equal to the average of the four surplus countries is
-
The ratio of the deficit of the first five deficit countries to the overall deficit of all the deficit countries is nearly equal to ?
-
The net total deficit/surplus is equal to ?

 Whatsapp
 Facebook

