Data Interpretation :: Bar charts
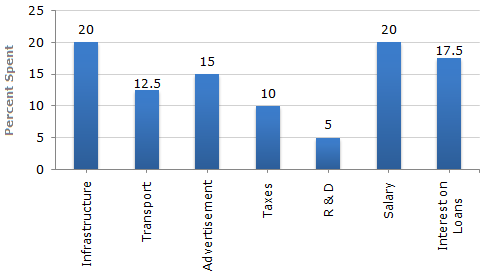
The bar graph given below shows the percentage distribution of the total expenditures of a company under various expense heads during 2003.
Percentage Distribution of Total Expenditure of a Company
-
The total amount of expenditures of the company is how many times of expenditure on research and development?
-
If the expenditure on advertisement is 2.10 crores then the difference between the expenditure on transport and taxes is?
-
What is the ratio of the total expenditure on infrastructure and transport to the total expenditure on taxes and interest on loans?
-
If the interest on loans amounted to Rs. 2.45 crores then the total amount of expenditure on advertisement, taxes and research and development
-
The expenditure on the interest on loans is by what percent more than the expenditure on transport?

 Whatsapp
 Facebook


 Ratio of the total expenditure to the expenditure on R & D
 x = [
x = [