Data Interpretation :: Bar charts
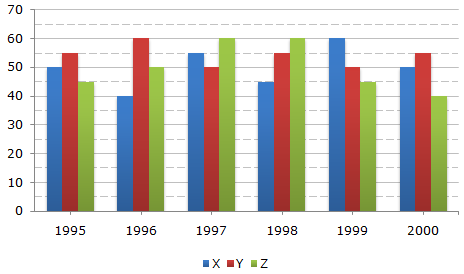
A soft drink company prepares drinks of three different flavours - X, Y and Z. The production of three flavours over a period of six years has been expressed in the bar graph provided below.
Production of Three Different Flavours X, Y and Z by a Company over the years (in lakh bottles)
-
The total production of flovour Z in 1997 and 1998 is what percentage of the total production of flavour X in 1995 and 1996?
-
For which flavour was the average annual production maximum in the given period?
-
What is the difference between the average production of flavour X in 1995, 1996 and 1997 and the average production of flavour Y in 1998, 1999 and 2000?
-
What was the approximate decline in the production of flavour Z in 2000 as compared to the production in 1998?
-
For which of the following years the percentage of rise/fall in production from the previous year is the maximum for the flavour Y?

 Whatsapp
 Facebook


 Maximum average production is for Flavour Y.
 33%.
33%.