Data Interpretation :: Pie charts
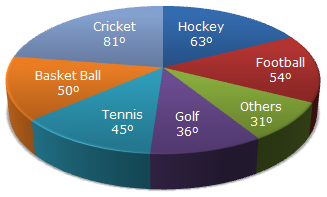
The circle-graph given here shows the spendings of a country on various sports during a particular year. Study the graph carefully and answer the questions given below it.
-
What percent of total spending is spent on Tennis?
-
If the total amount spent on sports during the year be Rs. 1,80,00,000 , the amount spent on Basketball exceeds on Tennis by:
-
How much percent less is spent on Football than that on Cricket?
-
If the total amount spent on sports during the year was Rs. 2 crores, the amount spent on Cricket and Hockey together was:

 Whatsapp
 Facebook


 Required percentage = Rs. [(