Data Interpretation :: Pie charts
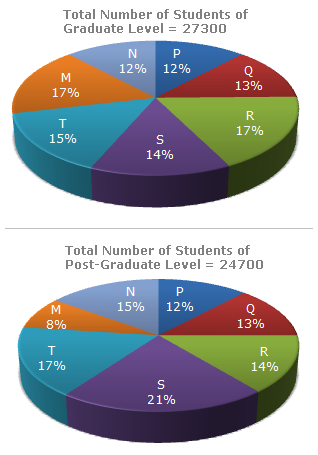
The following pie-charts show the distribution of students of graduate and post-graduate levels in seven different institutes in a town.
Distribution of students at graduate and post-graduate levels in seven institutes:
-
What is the total number of graduate and post-graduate level students is institute R?
-
What is the ratio between the number of students studying at post-graduate and graduate levels respectively from institute S?
-
How many students of institutes of M and S are studying at graduate level?
-
What is the ratio between the number of students studying at post-graduate level from institutes S and the number of students studying at graduate level from institute Q?
-
Total number of students studying at post-graduate level from institutes N and P is

 Whatsapp
 Facebook


 Total number of students at graduate in institutes M and S