Data Interpretation :: Line charts
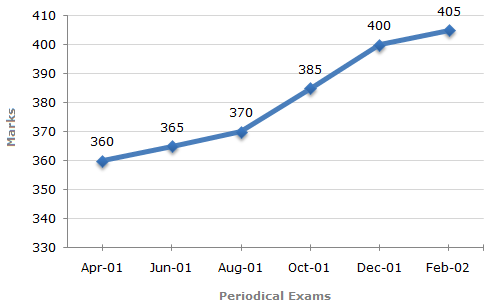
In a school the periodical examination are held every second month. In a session during April 2001 - March 2002, a student of Class IX appeared for each of the periodical exams. The aggregate marks obtained by him in each perodical exam are represented in the line-graph given below.
Marks Obtained by student in Six Periodical Held in Every Two Months During the Year in the Session 2001 - 2002.
Maximum Total Marks in each Periodical Exam = 500
-
In which periodical exams did the student obtain the highest percentage increase in marks over the previous periodical exams ?
-
The total number of marks obtained in Feb. 02 is what percent of the total marks obtained in April 01 ?
-
What is the percentage of marks obtained by the student in the periodical exams of August, 01 and Oct, 01 taken together ?
-
What are the average marks obtained by the student in all the periodical exams during the last session ?
-
In which periodical exams there is a fall in percentage of marks as compared to the previous periodical exams ?

 Whatsapp
 Facebook


 381.6
381.6