ECE :: Network Analysis and Synthesis
-
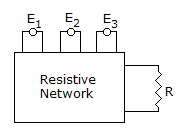
In the circuit of figure, the power consumed in resistance R is measured when one source is acting at one time. These values are 18 W, 50 W and 98 W. When all source act together the maximum and minimum power can be
-
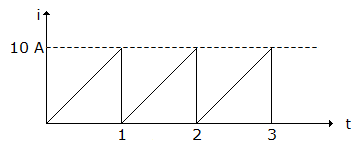
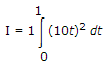
Current having waveform in figure flows through 10 Ω resistance. Average power is
-
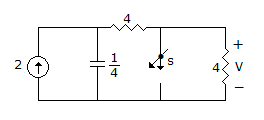
S is closed for a long time and steady state is reached. S is opened at t(0-). The voltage marked V is V0 at t = 0+ and Vf at t = ∞. Then value of V0 and Vf are respectively
-
Two voltages are v1= 100 sin (ωt + 15°) and v2 = 60 cosωt, then
-
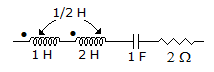
A constant k low pass T section filter has a characteristic impedance of 600 p at zero frequency. At f = fc the characteristic impedance is

 Whatsapp
 Facebook


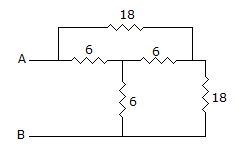
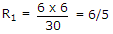
 (6 + 6/5) || (18 + 18/5) = 5.4
 = 5.773 A, P = I2R = 333.3 W.
 .
.

 = 4
= 4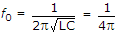 .
.