Discussion :: GATE ECE
-
The Bode plot of a transfer function G(s) is shown in the figure below.
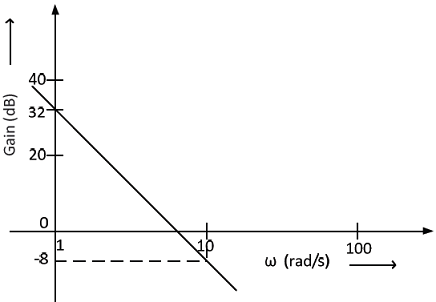 The gain (20 log |G(s)| ) is 32 dB and -8 dB at 1 rad/s and 10 rad/s respectively. The phase is negative for all ω. Then G(s) is

 Whatsapp
 Facebook


Answer : Option B
Explanation :
-NA-
Be The First To Comment