Discussion :: Automatic Control Systems
-
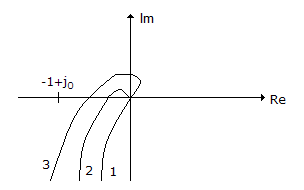
The given figure shows three Nyquist plots of G(s) H(s) = e-sT/[s(s + 1)] for different values of T. The curves 1, 2, 3 can be
|
A.
for T = 0, 0.5 and 1 respectively
|
|
B.
for T = 1, 0.5 and 0 respectively
|
|
C.
for T = 0.5, 1 and 0 respectively
|
|
D.
for T = 0, 1 and 0.5 respectively
|

 Whatsapp
 Facebook


Answer : Option A
Explanation :
No answer description available for this question.
Be The First To Comment