Discussion :: Network Analysis and Synthesis
-
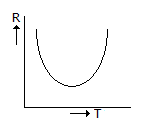
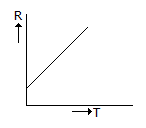
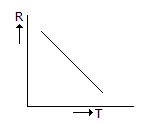
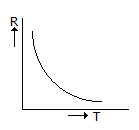
Which of the under-given graphs shown in figure gives variation in resistance of a copper conductor with temperature?

 Whatsapp
 Facebook


Answer : Option B
Explanation :
No answer description available for this question.
Be The First To Comment