Discussion :: Network Analysis and Synthesis
-
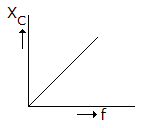
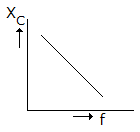
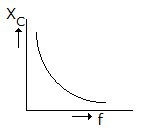
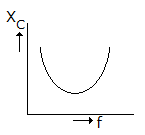
Which of the following graphs in figure correctly represents the variation of capacitive reactance with frequency?

 Whatsapp
 Facebook


Answer : Option C
Explanation :
No answer description available for this question.
Be The First To Comment