Data Interpretation :: Pie charts
Study the following graph carefully and answer the questions given below:
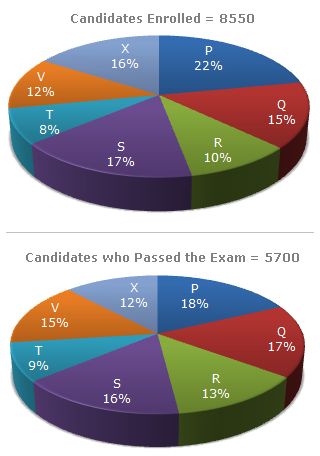
Distribution of candidates who were enrolled for MBA entrance exam and the candidates (out of those enrolled) who passed the exam in different institutes:
-
What percentage of candidates passed the Exam from institute T out of the total number of candidates enrolled from the same institute?
-
Which institute has the highest percentage of candidates passed to the candidates enrolled?
-
The number of candidates passed from institutes S and P together exceeds the number of candidates enrolled from institutes T and R together by:
-
What is the percentage of candidates passed to the candidates enrolled for institutes Q and R together?
-
What is the ratio of candidates passed to the candidates enrolled from institute P?

 Whatsapp
 Facebook


 Required percentage = [