Data Interpretation :: Pie charts
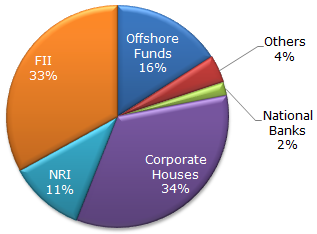
The following pie chart shows the amount of subscriptions generated for India Bonds from different categories of investors.
Subscriptions Generated for India Bonds
-
In the corporate sector, approximately how many degrees should be there in the central angle ?
-
If the investment by NRI's are Rs 4,000 crore, then the investments by corporate houses and FII's together is:
-
What percentage of the total investment is coming from FII's and NRI's ?
-
If the total investment other than by FII and corporate houses is Rs 335,000 crore, then the investment by NRI's and Offshore funds will be (approximately) ?
-
If the total investment flows from FII's were to be doubled in the next year and the investment flows from all other sources had remained constant at their existing levels for this year, then what would be the proportion of FII investment in the total investment into India Bonds next year (in US $ millions) ?
-
What is the approximate ratio of investment flows into India Bonds from NRI's to corporate houses ?

 Whatsapp
 Facebook

