Data Interpretation :: Line charts
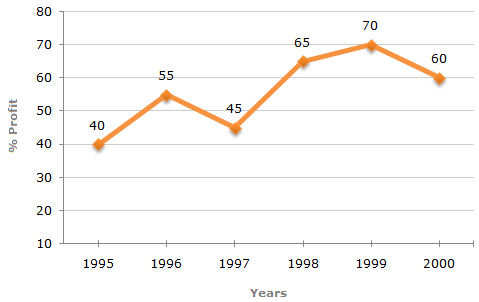
The following line graph gives the annual percent profit earned by a Company during the period 1995 - 2000.
Percent Profit Earned by a Company Over the Years.
%Profit = \(\frac { \text{ Income -Expenditure}} {Expenditure } \) x 100
-
If the expenditures in 1996 and 1999 are equal, then the approximate ratio of the income in 1996 and 1999 respectively is?
-
If the income in 1998 was Rs. 264 crores, what was the expenditure in 1998?
-
If the profit in 1999 was Rs. 4 crores, what was the profit in 2000?

 Whatsapp
 Facebook


 Expenditure in 1998 = Rs. 160 crores