Data Interpretation :: Line charts
Study the following line graph and answer the questions.
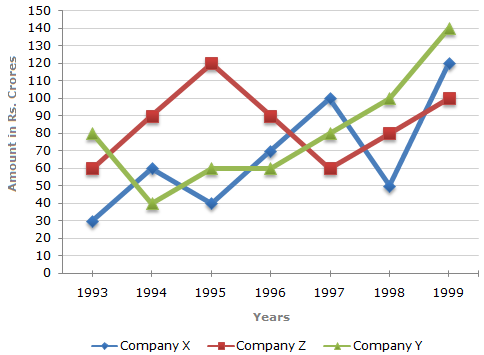
Exports from Three Companies Over the Years (in Rs. crore)
-
For which of the following pairs of years the total exports from the three Companies together are equal?
-
Average annual exports during the given period for Company Y is approximately what percent of the average annual exports for Company Z?
-
In which year was the difference between the exports from Companies X and Y the minimum?
-
What was the difference between the average exports of the three Companies in 1993 and the average exports in 1998?
-
In how many of the given years, were the exports from Company Z more than the average annual exports over the given years?

 Whatsapp
 Facebook


 Required percentage = [
  93.33%