Home / Data Interpretation / Bar charts :: Bar chart 18

Data Interpretation :: Bar charts

Directions To Solve

Study the following bar charts and answer the questions.

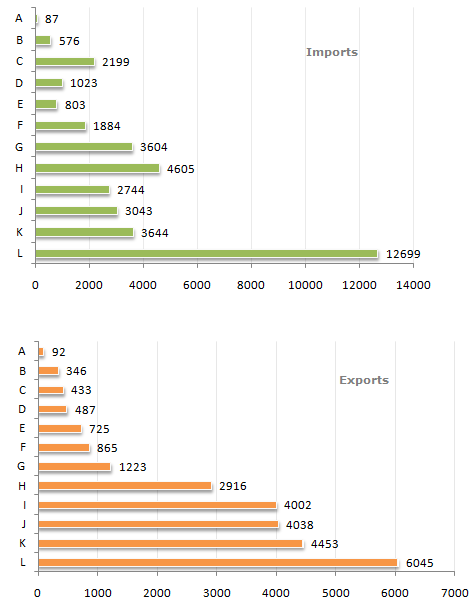
Foreign Trade (Imports and Exports) by countries for the year (1993 - 1994)

  1. The ratio of the maximum exports to the minimum imports was closest to ?

  2. A.

    64

    B.

    69

    C.

    74

    D.

    79


  3. How many countries exhibited a trade surplus ?

  4. A.

    5

    B.

    4

    C.

    3

    D.

    6


  5. The total trade deficit/surplus for all the countries put together was ?

  6. A.

    11286 surplus

    B.

    11286 deficit

    C.

    10286 deficit

    D.

    None of these


  7. The highest trade deficit was shown by which country ?

  8. A.

    C

    B.

    G

    C.

    H

    D.

    L


  9. The ratio of Exports to Imports was highest for which country ?

  10. A.

    A

    B.

    I

    C.

    J

    D.

    K