Data Interpretation :: Bar charts
Study the following bar chart and answer the questions carefully.
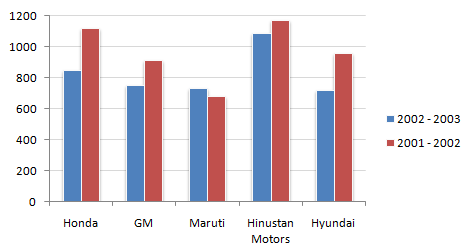
Sales Turnover of 5 Companies (in Rs. crores)
-
What is the percentage change in the overall sales turnover of the five companies together between 2001 - 2002 and 2002 - 2003 ?
-
What is the absolute change in overall sales turnover of the five companies together between 2001 - 2002 and 2002 - 2003 ?
-
Which of the companies shows the maximum percentage difference in sales turnover between the two years ?
-
What should have been the sales turnover of GM in 2002 - 2003 to have shown an excess of the same quantum over 2001 - 2002 as shown by the sales turnover of Maruti ?
-
What is the approximate difference between the average sales turnover of all the companies put together between the years 2001 - 2002 and 2002 - 2003 ?

 Whatsapp
 Facebook

