Data Interpretation :: Bar charts
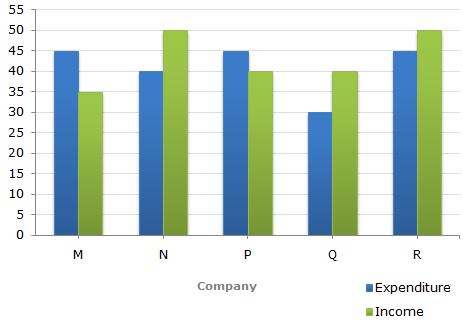
The following bar graph shows the Income and Expenditures (in million US $) of five companies in the year 2001. The percent profit or loss of a company is given by
| % Profit/Loss = \(\frac { \text { Income -Expenditure} } { Expenditure } \) x 100 | ||||
-
The companies M and N together had a percentage of profit/loss of?
-
In 2001, what was the approximate percentage of profit/loss of all the five Companies taken together?
-
For Company R, if the expenditure had increased by 20% in year 2001 from year 2000 and the company had earned profit of 10% in 2000, what was the Company's income in 2000 (in million US $)?
-
If the income of Company Q in 2001 was 10% more than its income in 2000 and the Company had earned a profit of 20% in 2000, then its expenditure in 2000 (in million US $) was?

 Whatsapp
 Facebook


 Percent Profit/Loss of companies M and N together
 5%.
5%. x = 37.5.
 %Profit in 2000 = 10%]