Data Interpretation :: Bar charts
Study the bar chart and answer the question based on it
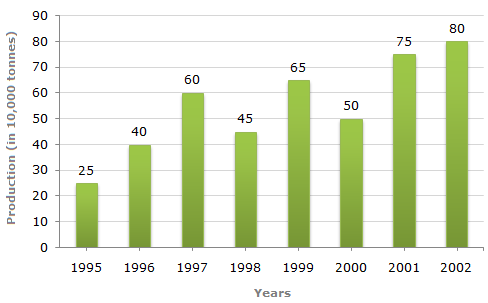
. Production of Fertilizers by a Company (in 1000 tonnes) Over the Years
-
What was the percentage decline in the production of fertilizers from 1997 to 1998?
-
The average production of 1996 and 1997 was exactly equal to the average production of which of the following pairs of years?
-
What was the percentage increase in production of fertilizers in 2002 compared to that in 1995?
-
In which year was the percentage increase in production as compared to the previous year the maximum?
-
In how many of the given years was the production of fertilizers more than the average production of the given years?

 Whatsapp
 Facebook


 There is a decline of 25% in production from 1997 to 1998.